Stat Chat: Interacting with Ireland's Energy Data
New webpages on the SEAI website help users to visualise definitive annual energy data from the National Energy Balance.
SEAI’s Energy Statistics Team compiles and publishes Ireland’s National Energy Balance. The National Energy Balance is the definitive source of data for energy supply, transformation and demand in Ireland. There are two publication dates in our diary related to the National Energy Balance – the interim balance (published in May) contains data on energy supply and transformation and the full balance (published in September) contains data on energy supply, transformation and demand in Ireland. It takes time to collect and check the definitive data, so the data published in May and September of this year are for last year.
SEAI has just published this year’s full National Energy Balance, and with it, we have released a brand-new suite of webpages illustrating the definitive annual data from the National Energy Balance, in a series of interactive data-views. This data will be updated in line with updates to the National Energy Balance in May and September. We will be working to curate, refresh and continuously improve these webpages further, so watch this space!
The aim of these webpages is to help users to more easily visualise and interact with Ireland’s definitive energy data, and how our energy supply and demand have changed over the last twenty years. This gives users easy access to Ireland’s data, helping to address the need for timely and trusted data to inform evidence-led energy policy and determine the pace of progress against binding energy and climate targets.
The new webpages provide data on four key areas:
- Energy Supply
- Energy Transformations
- Energy Demand
- Energy Products
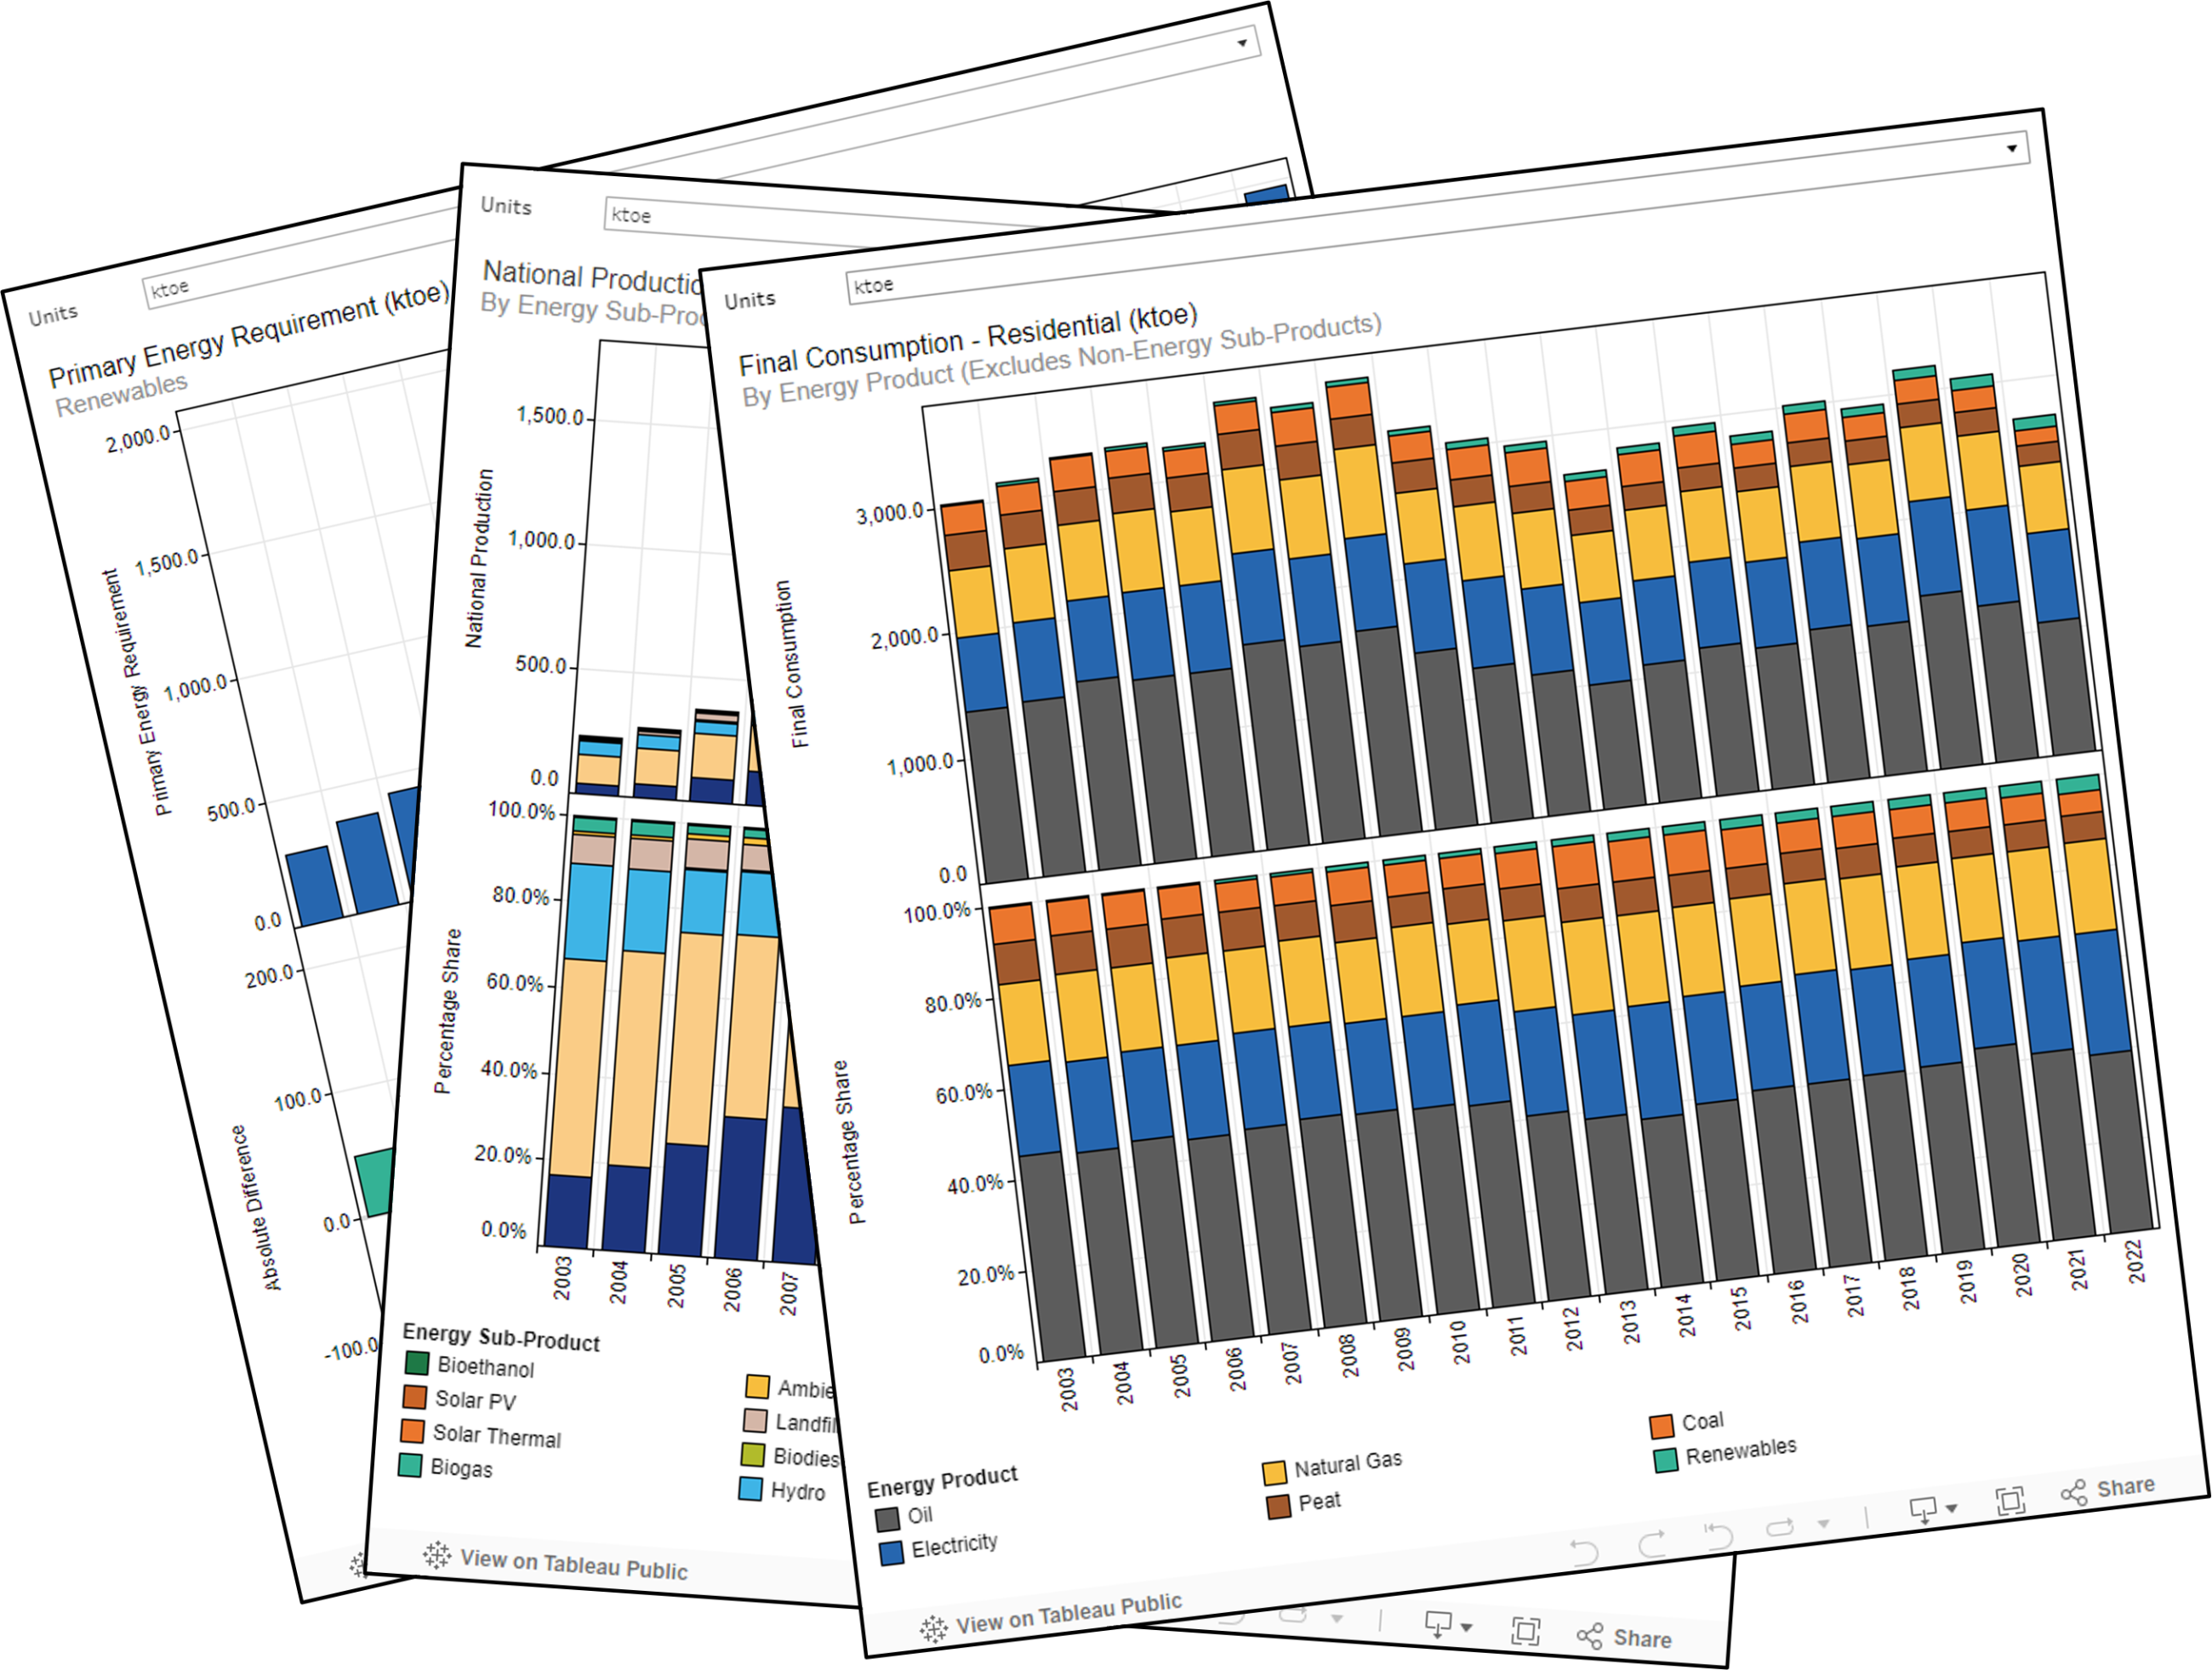
The data views have interactive tooltips which show detailed information when an element is scrolled over with a cursor. Users can change units between kilotonnes of oil equivalent (ktoe), terawatt hours (TWh) and terajoules (TJ). Most data views allow for customised energy product selection, and the data in the views can be downloaded as images, data tables, PDFs, or Tableau Workbooks.
The data-panels act to ‘slice’ the data in the National Energy Balance into different useful ‘cuts’ of information, and we have used a variety of plots to best illustrate key trends:
- Swing plots to clearly show year-to-year changes
- Combined bar- and -line plots to show how different supply streams sum together
- Bar- and percentage-share plots to show what sectors are adding to total demand
We hope that these new webpages from SEAI will become a valuable resource that helps policy makers, journalists, businesses, and the Irish public become more comfortable and informed on the numbers behind Ireland’s energy landscape. It’s only by better understanding these past energy trends that we can credibly speak to the trends that we need to see in the future, on our way to Ireland’s 2030 targets, and beyond.

